Budgets — Monthly Targets & Recurring vs Flexible
Overview
Section titled “Overview”The Budget page lets you set monthly spending targets by category or subcategory, track progress in real time, and review historical budget performance. The page has four tabs: Overview, Recurring Charges, Setup, and History (Pro).
Overview Tab
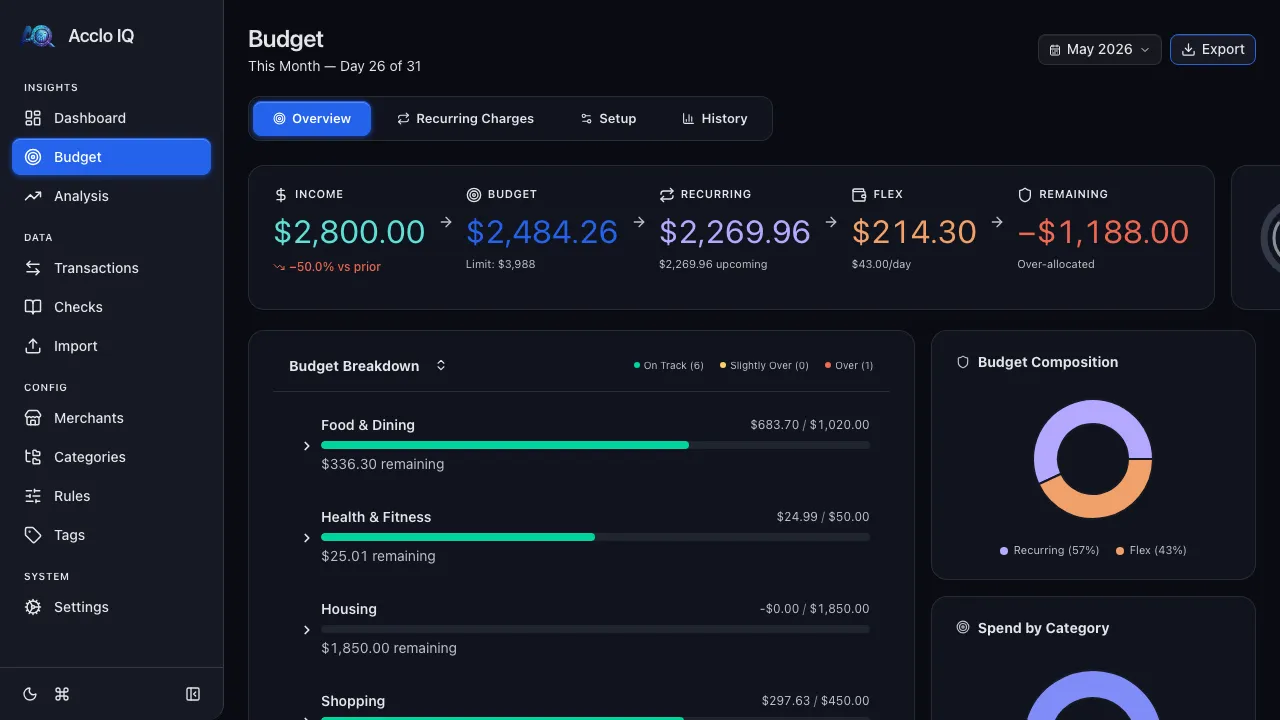
Section titled “Overview Tab”The Overview tab shows your current budget status at a glance.
Budget Flow Row
Section titled “Budget Flow Row”The top row presents your monthly plan as a left-to-right flow:
- Income — income for the selected month, with a comparison to the prior month when available
- Budget — remaining budget capacity and the monthly budget limit
- Recurring — confirmed recurring spending, plus upcoming recurring charges when any remain
- Flex — discretionary budget remaining after recurring commitments
- Remaining — income left after budget allocation, or an over-allocation warning
A separate Month Progress card shows how far through the month you are and how much of the budget has been spent.
Category Budgets
Section titled “Category Budgets”Each budgeted category shows a progress bar with color coding:
| Color | Meaning |
|---|---|
| Green | Under 80% of budget — on track |
| Yellow | 80–99% of budget — approaching limit |
| Red | 100%+ of budget — over budget |
Click any category to expand and see subcategory breakdowns. Click a row to drill down to the matching transactions.
Unbudgeted spending appears grouped separately so you can see where money goes outside your budget.
Recurring vs Flex Split
Section titled “Recurring vs Flex Split”When a category has confirmed recurring charges (subscriptions, bills), its progress bar splits into two segments:
| Segment | Color | Meaning |
|---|---|---|
| Recurring | Blue (accent) | Spending on confirmed recurring charges |
| Flex | Green/Yellow/Red | Discretionary spending against remaining budget |
The label below shows both amounts: $X/$Y recurring · $X/$Y flex. This tells you at a glance how much of each category is committed vs freely available.
Spend by Category Chart
Section titled “Spend by Category Chart”A donut chart showing the percentage breakdown of spending across categories. Click to toggle between category and subcategory views.
Recurring Charges Tab
Section titled “Recurring Charges Tab”The Recurring Charges tab combines management and detection of recurring charges in one place.
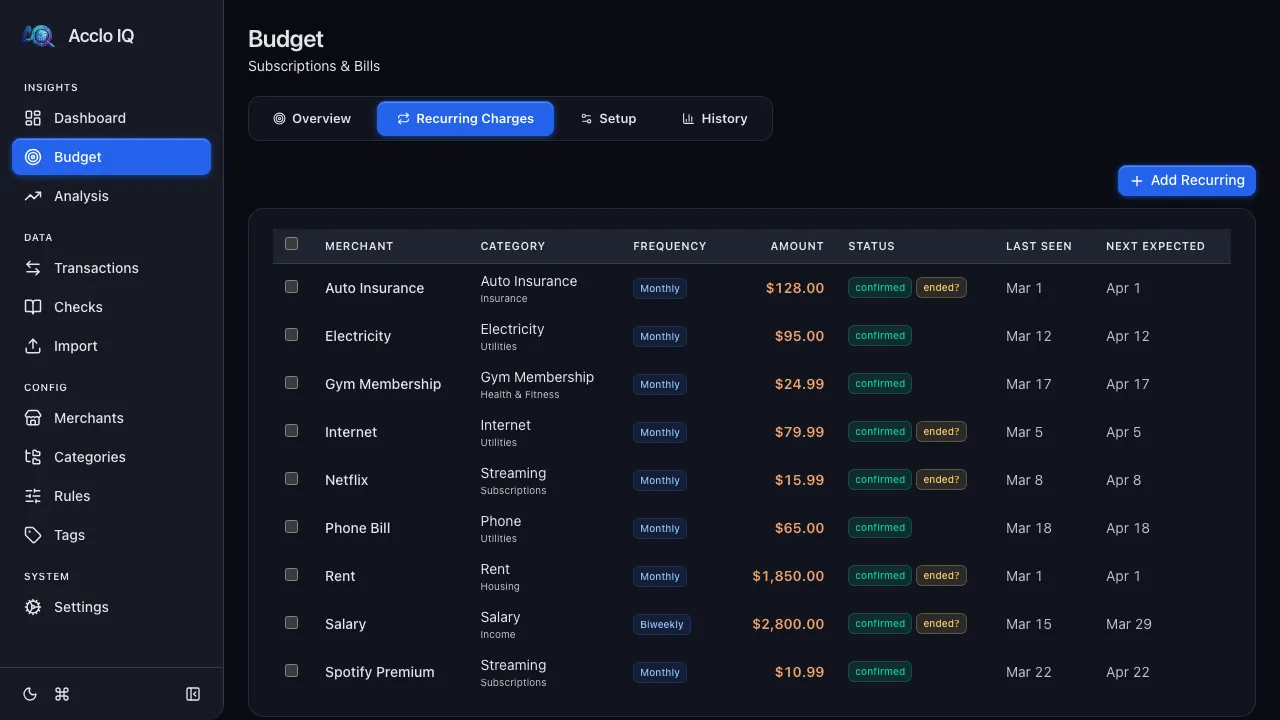
It shows two sections:
- Manage — a table of all confirmed and manually added recurring entries. Click Add Recurring to create an entry manually, or click any row to edit it in the detail panel.
- Detected — auto-detected candidates appear below the manage table when available. Each candidate shows the merchant, frequency, confidence score, and buttons to Confirm or Dismiss the pattern.
Confirmed recurring amounts integrate with budget progress bars on the Overview tab, splitting each category into a committed (recurring) segment and a flex (discretionary) segment. Clicking the Recurring Status card on the Overview tab navigates directly to this tab.
For full details on detection logic, tagging behavior, and free vs pro differences, see the Recurring guide.
Setup Tab
Section titled “Setup Tab”The Setup tab is where you create and manage budget targets.
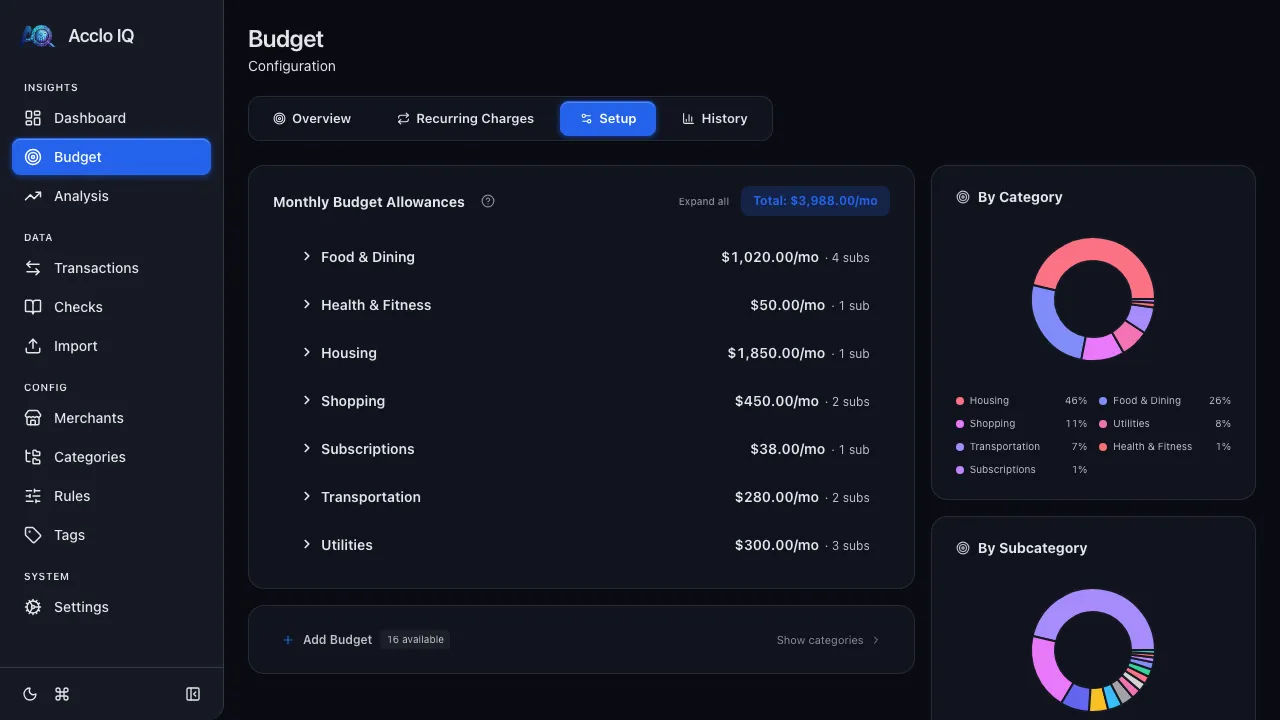
Setting a Budget
Section titled “Setting a Budget”- Find the category in the list
- Click Set budget next to the category name
- Enter a monthly amount and press Enter
You can set budgets at either the category level (one amount for the whole category) or the subcategory level (individual amounts per subcategory). You cannot mix both for the same category — choose one approach.
Recurring Floor
Section titled “Recurring Floor”Categories with confirmed recurring charges display a mini bar below each budget row showing the recurring vs flex allocation. If you set a budget below the recurring floor, a warning appears: “Budget is below recurring commitment.”
The sidebar Summary card also shows the total recurring and flex amounts with percentages.
Editing a Budget
Section titled “Editing a Budget”Click any existing budget amount to edit it inline. The total updates automatically.
Removing a Budget
Section titled “Removing a Budget”Click the trash icon next to any budget amount to remove it.
Adding Unbudgeted Categories
Section titled “Adding Unbudgeted Categories”Click + Add Budget at the bottom to see categories that don’t have budgets yet. The badge shows how many are available.
Summary Sidebar
Section titled “Summary Sidebar”The right sidebar shows:
- Pie charts of budget allocation by category and subcategory
- Summary stats: category budget count, subcategory budget count, monthly total, and annualized total
History Tab (Pro)
Section titled “History Tab (Pro)”The History tab shows how your spending compares to your budget over time.
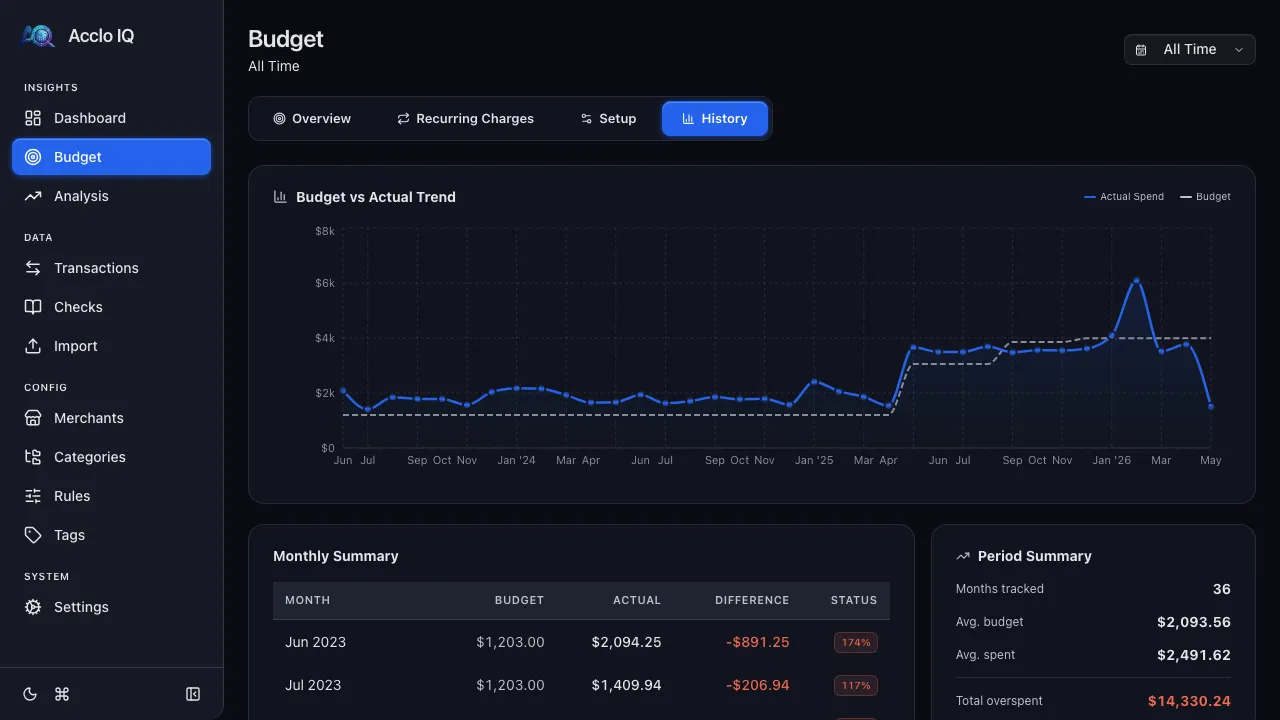
Budget vs. Actual Trend
Section titled “Budget vs. Actual Trend”An area chart showing monthly actual spending against your budget line. Green areas show months under budget; red areas show months over budget.
Monthly Summary Table
Section titled “Monthly Summary Table”| Column | Description |
|---|---|
| Month | Calendar month |
| Budget | Target amount |
| Actual | What you spent |
| Difference | Over or under (color-coded) |
| Status | Percentage badge (green or red) |
Period Summary
Section titled “Period Summary”Sidebar stats including months tracked, average budget, average spend, and total saved.
Best and Worst Month
Section titled “Best and Worst Month”Highlights your most and least successful budget months.
Export
Section titled “Export”Click Export in the toolbar to download the current budget-vs-actual data as CSV or Excel (.xlsx).
Related Guides
Section titled “Related Guides”- Categories — manage the categories that budgets target
- Dashboard — see spending trends alongside budget data
- Recurring — manage recurring charges that feed into budget tracking
- Transactions — drill down to the transactions behind any budget number