Dashboard — Financial Overview & KPI Cards
Overview
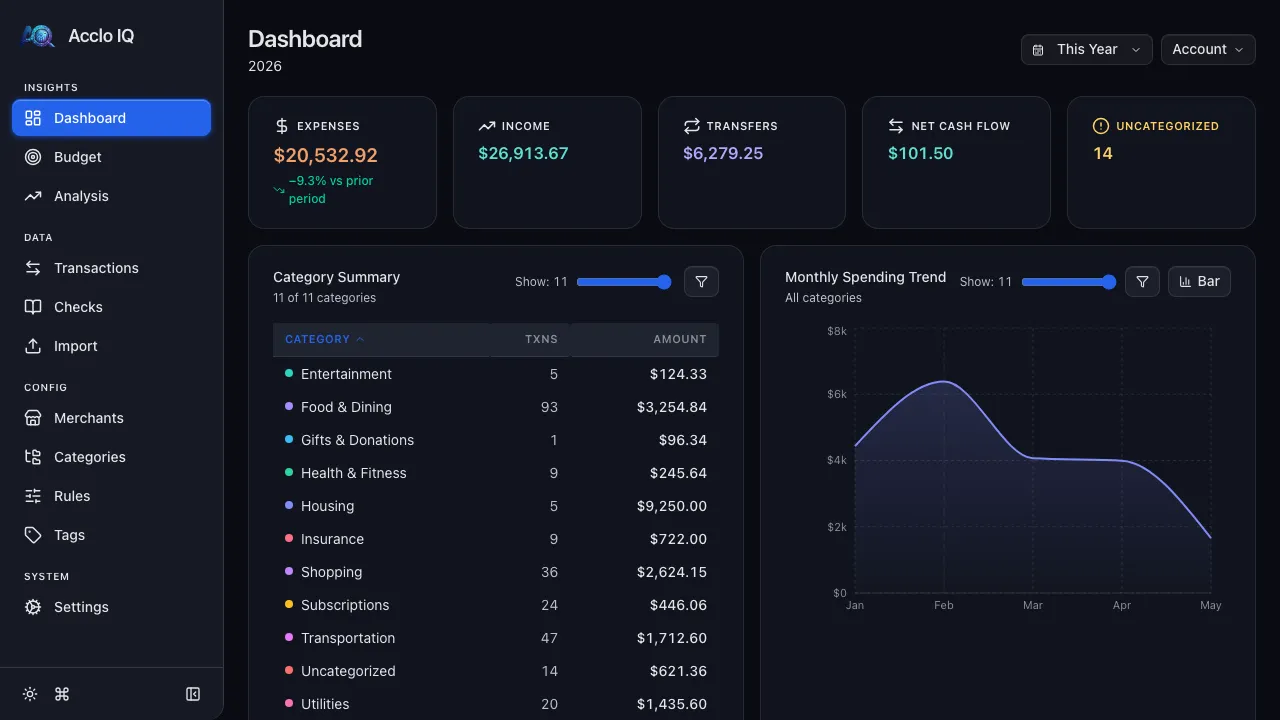
Section titled “Overview”The Dashboard provides a real-time overview of your financial activity. It shows key metrics, spending trends, and breakdowns by category, subcategory, and merchant — all filterable by time period and account.
KPI Cards
Section titled “KPI Cards”Five summary cards across the top update in real time as you change filters:
| Card | Description |
|---|---|
| Expenses | Total spending for the period, with percentage change vs. the prior period |
| Income | Total income received |
| Transfers | Total internal transfers between accounts |
| Net Cash Flow | Income minus expenses (green if positive, red if negative) |
| Uncategorized | Count of transactions without a category (warning color if > 0) |
Click any card to drill down to the Transactions page filtered to that flow type.
Filters
Section titled “Filters”Period Filter
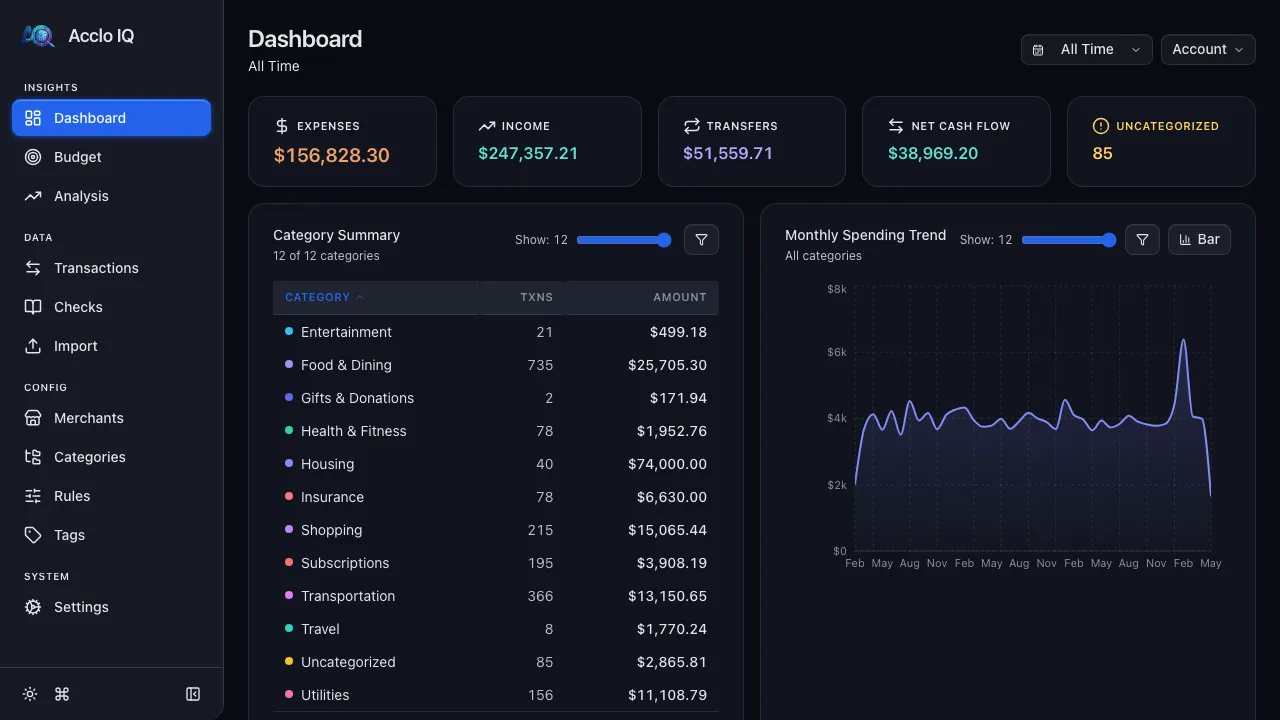
Section titled “Period Filter”The period dropdown in the top-right controls the time range for all dashboard data. Options include This Year, This Month, Last Month, and more. Selecting All Time removes time boundaries and aggregates your entire transaction history into a single view.
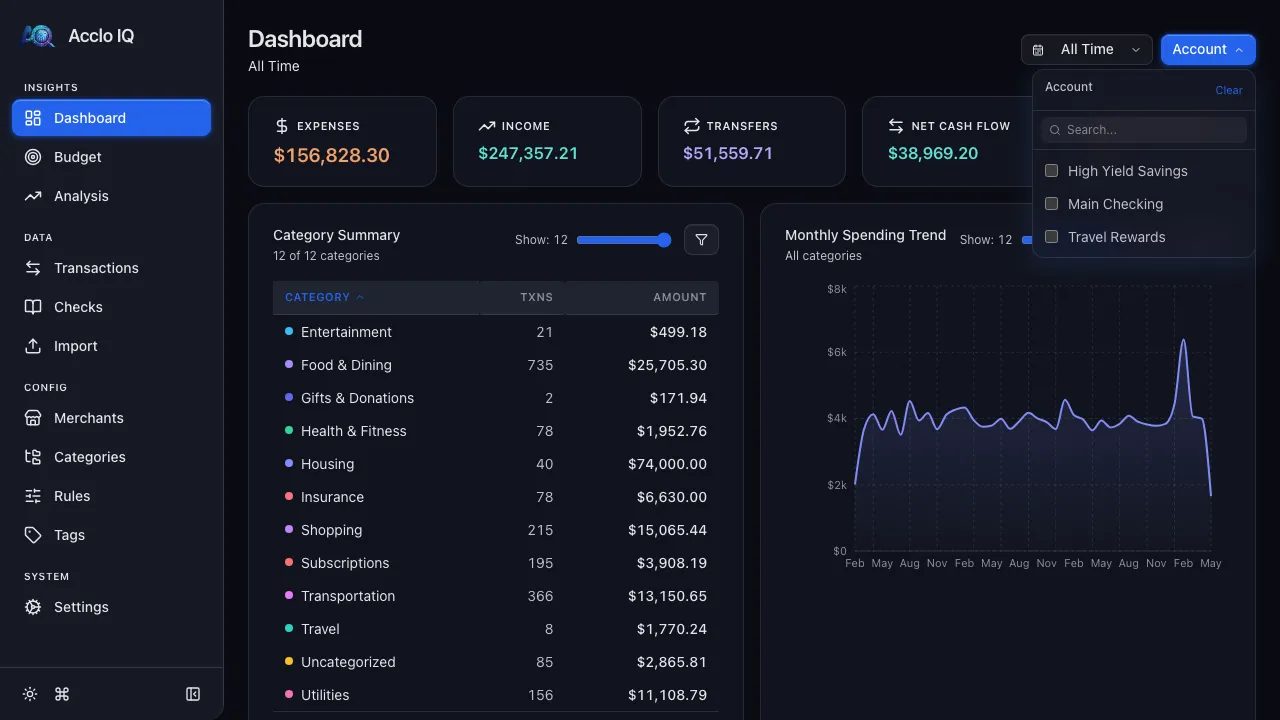
Account Filter
Section titled “Account Filter”The Account dropdown filters all data to one or more specific accounts. By default, all accounts are included. Open the dropdown to isolate spending for a single bank, credit card, or investment account.
Summary Tables
Section titled “Summary Tables”Category Summary
Section titled “Category Summary”A sortable table showing each category with its transaction count and total amount. Click the Show slider to control how many categories are displayed, or use the filter icon to show/hide specific categories.
Click any category row to drill down — the subcategory and merchant tables below will filter to that category, and the trend charts update to show only that category’s data. A back arrow appears in the header to clear the drill-down.
Subcategory Summary
Section titled “Subcategory Summary”Same layout as Category Summary, filtered by the selected category (if any). Click a subcategory row to further drill down to merchant-level data.
Merchant Summary
Section titled “Merchant Summary”Shows top merchants by spending amount, filtered by the selected category and subcategory.
Trend Charts
Section titled “Trend Charts”Monthly Spending Trend
Section titled “Monthly Spending Trend”A bar or line chart showing total spending by month. Toggle between bar and line view using the Line button. The chart respects category/subcategory drill-down selections.
Spending Trend by Category
Section titled “Spending Trend by Category”A multi-series chart showing how spending in each category changes over time. Each category gets a distinct color. Use the slider to control how many categories are shown (up to 5).
Spending Trend by Subcategory
Section titled “Spending Trend by Subcategory”Same as the category trend but broken down by subcategory.
Drill-Down Navigation
Section titled “Drill-Down Navigation”Every clickable element on the Dashboard — KPI cards, table rows, chart segments — navigates to the Transactions page with the appropriate filters pre-applied. This lets you go from a high-level overview to the specific transactions behind any number.
Related Guides
Section titled “Related Guides”- Transactions — view the transactions behind any dashboard metric
- Categories — manage the category hierarchy
- Budgets — set spending targets by category
- Analysis — deeper trends and year-over-year comparisons (Pro)